









New Delhi: Bitcoin could face a deeper correction towards $74,500 if its recent decline continues, according to an analysis by cryptocurrency analytics platform CryptoQuant. The estimate follows a retreat from an October 5 high of $87,027 to $80,404 on October 9, bringing the cryptocurrency’s latest pullback close to the average correction recorded during previous bull-market cycles.
The analysis, published by CryptoQuant contributor MAC_D on October 9, examines historical Bitcoin price movements to estimate how far the cryptocurrency could fall during a broader upward market trend. The $74,500 figure is a potential downside reference based on historical data, not a confirmed price target or a prediction that Bitcoin will necessarily reach that level.
The latest decline has renewed attention on Bitcoin’s ability to maintain its recovery amid volatile market conditions. Although the cryptocurrency has experienced substantial advances during previous bull markets, historical data shows that sharp corrections can occur even when the broader trend remains positive.
How CryptoQuant calculated the $74,500 level
According to the analysis, Bitcoin fell from $87,027 on October 5 to $80,404 on October 9. The decline amounted to $6,623, or approximately 7.61%.
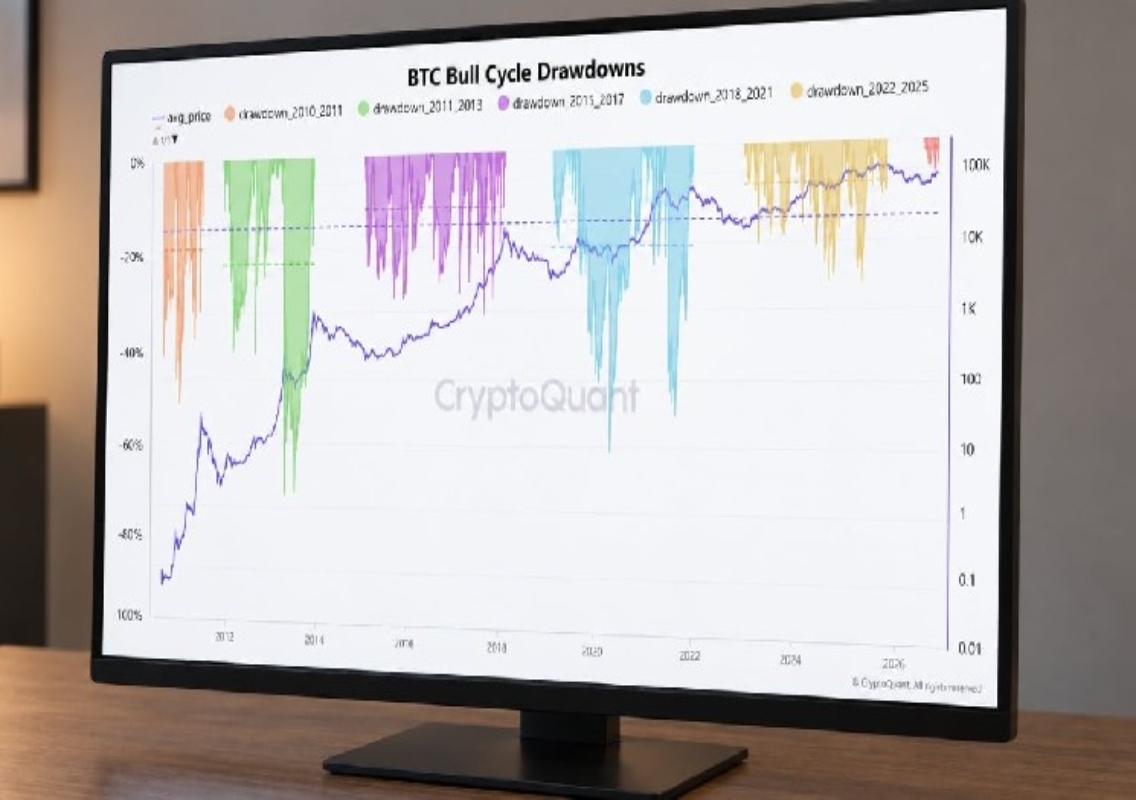
CryptoQuant compared this move with the average drawdowns recorded across five historical Bitcoin bull-market cycles. A drawdown measures the percentage decline from a previous price peak to a subsequent lower level.
The analysis identified an average historical correction of 14.39% across the five periods examined. Applying that percentage to Bitcoin’s October 5 high produces a level of approximately $74,500.
The calculation provides a historical comparison for traders monitoring possible downside scenarios. It does not establish that the market will follow the same pattern, as Bitcoin’s price is influenced by changing liquidity conditions, investor demand, macroeconomic developments and other factors.
The recent correction was also close to the average setback recorded during the 2022–2025 cycle, when Bitcoin’s average drawdown was reported at 7.58%. However, the broader historical record shows that earlier bull markets experienced considerably deeper declines.
Bitcoin’s historical corrections vary widely
CryptoQuant’s analysis compared average drawdowns across five periods in Bitcoin’s market history.
| Historical period | Average drawdown |
|---|---|
| 2010–2011 | 18.41% |
| 2011–2013 | 21.71% |
| 2015–2017 | 10.93% |
| 2018–2021 | 19.39% |
| 2022–2025 | 7.58% |
| Overall average | 14.39% |
The figures show that corrections have varied considerably between market cycles. During the 2011–2013 period, the average drawdown was 21.71%, while the 2018–2021 cycle recorded an average of 19.39%.
By comparison, the latest cycle examined in the report had a substantially lower average correction of 7.58%.
This difference may reflect changes in market participation, liquidity and the composition of Bitcoin holders over time. However, a lower historical average does not guarantee that future corrections will remain shallow.
Individual events can produce declines significantly larger than the average. Investors therefore need to distinguish between a historical benchmark and a reliable forecast of future price movements.
CryptoQuant indicators previously showed recovery signals
The report also discussed indicators that had pointed towards improving market conditions before the latest pullback.
CryptoQuant’s Bull Score, which combines 10 indicators relating to demand, holder profitability, network activity and liquidity, rose from 30 to 80 in August, according to the analysis.
The increase suggested that several underlying market measures had improved during Bitcoin’s recovery. Nevertheless, the score should not be interpreted as a guarantee that prices will continue rising.
The report also cited a signal identified by CryptoQuant contributor Darkfost on September 24. The signal involved a change in the relationship between the estimated acquisition costs of newer Bitcoin holders and longer-term holders whose coins had moved within a seven-year period.
Acquisition cost estimates are used to assess the prices at which different groups of investors may have obtained their holdings. Changes in these estimates can help analysts examine shifts in market positioning, although they cannot independently determine the direction of future prices.
CryptoQuant founder and chief executive Ki Young Ju had also suggested that increasing institutional ownership could contribute to smaller gains and shallower losses across market cycles. That remains an analytical view rather than a certainty about Bitcoin’s future behaviour.
$80,000 and $74,000–$75,000 levels draw attention
The analysis identified the area around $80,000 as a possible level for investors considering purchases spread over time. It also discussed a lower range of $74,000 to $75,000 for larger potential commitments.
These levels reflect the analyst’s approach to the historical drawdown calculation. They should not be interpreted as confirmed support levels or recommendations suitable for every investor.
The $74,000–$75,000 range sits approximately 13.82% to 14.97% below Bitcoin’s October 5 high of $87,027. It broadly corresponds to the 14.39% average drawdown used to calculate the $74,500 reference point.
Whether these levels become relevant will depend on how the market develops. If buying demand strengthens, Bitcoin could stabilise before reaching the lower range. Conversely, a deterioration in market conditions could lead to a deeper correction or price movements that fall outside the historical averages.
What the analysis means for Bitcoin investors
The latest report highlights the importance of evaluating Bitcoin’s price movements over multiple market cycles rather than relying on short-term changes alone.
Historical drawdowns can help investors understand the scale of corrections that have occurred during previous periods of rising prices. However, they do not account for every factor affecting the current market, and past performance cannot reliably predict future returns.
Bitcoin remains a volatile asset, and investors can face substantial losses even when long-term market indicators appear favourable. Price levels identified by technical or historical analysis are therefore best treated as reference points rather than assured entry or exit levels.
For now, CryptoQuant’s $74,500 calculation offers one possible downside scenario if the correction deepens. The next phase of Bitcoin’s price movement will determine whether the recent decline remains limited or develops into a larger pullback.