







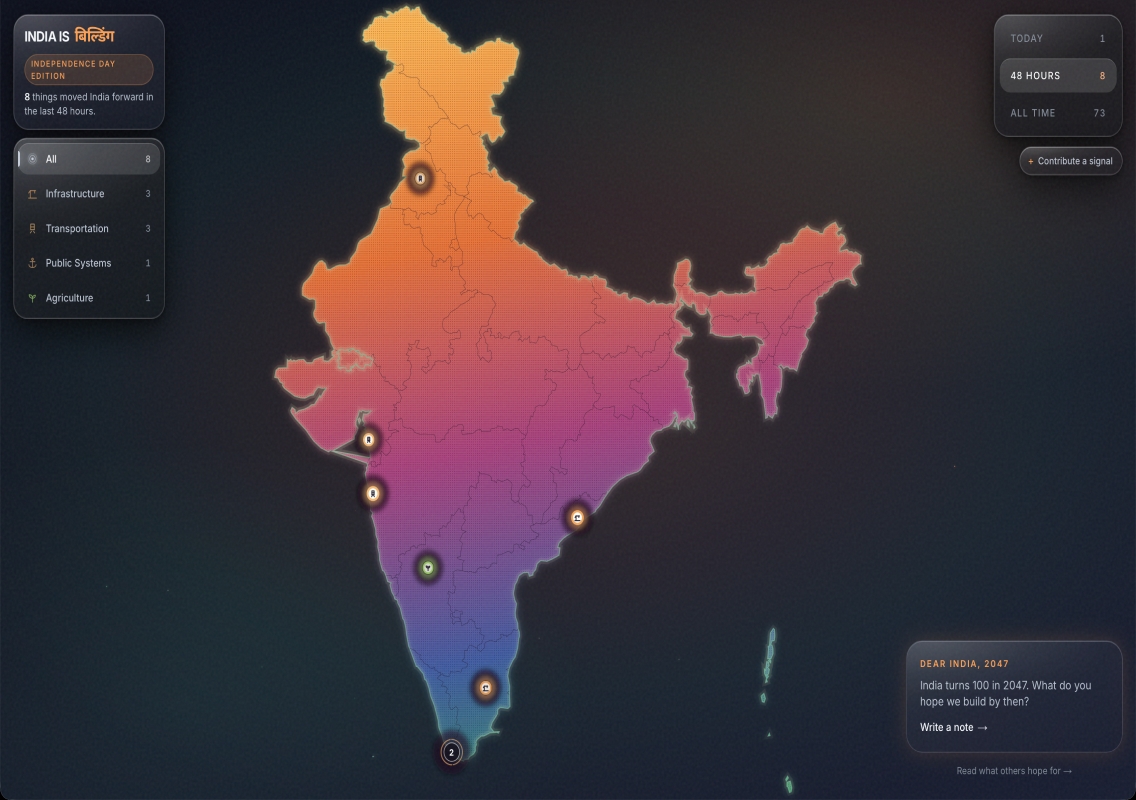


In a fast-paced digital landscape, it is easy to lose sight of a country’s macroeconomic progress. Every day, scattered across local newspapers and niche tech blogs, there are stories of new startups launching, infrastructure being completed, and scientific breakthroughs being made. But what if you could see all of that progress happening at once, on a single screen?
On August 15, 2026, perfectly timed for India’s Independence Day, developer Swapnil Dubey (@swpnldubey) released a project designed to do exactly that. The platform, aptly named indiaisbuilding.live, serves as a centralized, interactive dashboard that visualizes the nation’s daily development.
The Vision: Consolidating Progress
Dubey announced the launch on X with a clear and ambitious mission statement:
“i made a website where you can watch India being built, live. every day, things are being built, launched, discovered and improved across the country. I wanted one place where you could actually see all of it happening.”
The core problem this platform solves is information fragmentation. National progress is often incremental and highly localized. By aggregating these milestones—whether it’s a new solar plant in Gujarat, a deep-tech AI startup in Bengaluru, or a defense breakthrough in Hyderabad—the website transforms isolated data points into a cohesive, visual narrative of national growth.
Navigating the Dashboard
Based on the preview shared by the creator, indiaisbuilding.live features a sleek, dark-mode interactive map of the subcontinent populated with glowing nodes. Each node represents a specific recent development, anchoring progress to its geographical reality.
Here is a breakdown of the platform’s key features:
- Comprehensive Categorization: The dashboard moves beyond traditional definitions of “building” (like concrete and steel) to track holistic growth across twelve distinct sectors:
- Space & Science
- Infrastructure & Transportation
- AI & Technology
- Energy & Manufacturing
- Startups & Research
- Public Systems, Education, & Defence Technology
- Time-Sensitive Filtering: Users can check the immediate pulse of the nation’s activity by filtering the data by “Today,” “48 Hours,” or “All Time.”
- The Progress Counter: A prominent tracker keeps a running tally of milestones, proudly displaying how many individual achievements have “moved India forward since we started watching.”
“Dear India, 2047”: A Collaborative Vision Board
Perhaps the most compelling feature of the dashboard isn’t just about what is being built today, but what the country hopes to build tomorrow.
In the corner of the interface lies a community feature titled “DEAR INDIA, 2047.” With India slated to turn 100 years old as an independent nation in 2047, this section acts as a digital time capsule. It prompts users with a simple question: “What do you hope we build by then?” allowing citizens to write a note and read the aspirations of others. It is a thoughtful addition that bridges present-day execution with future ambition.
The Bottom Line
In an era where digital feeds are often dominated by doomscrolling and polarizing debates, indiaisbuilding.live offers a refreshing, data-driven antidote. Swapnil Dubey has essentially built a live-action heartbeat monitor for Indian innovation. By turning abstract statistics into a tangible, interactive map, the platform doesn’t just tell you that India is building—it lets you watch it happen.